Venn Diagram

This tutorial will outline a couple of ways to create a Venn diagram using shapes, blending modes, and boolean operations. According to Wikipedia, “a Venn diagram consists of multiple overlapping closed curves, usually circles, each representing a set.”
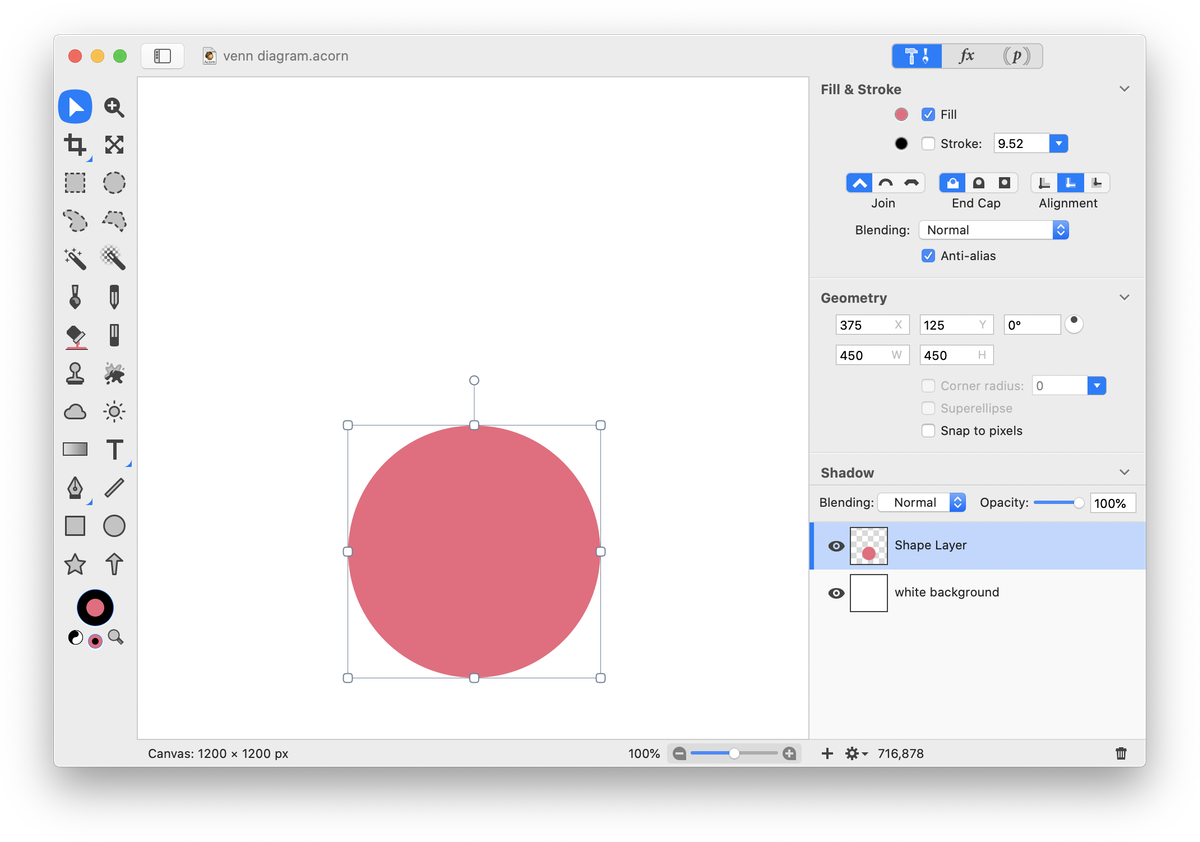
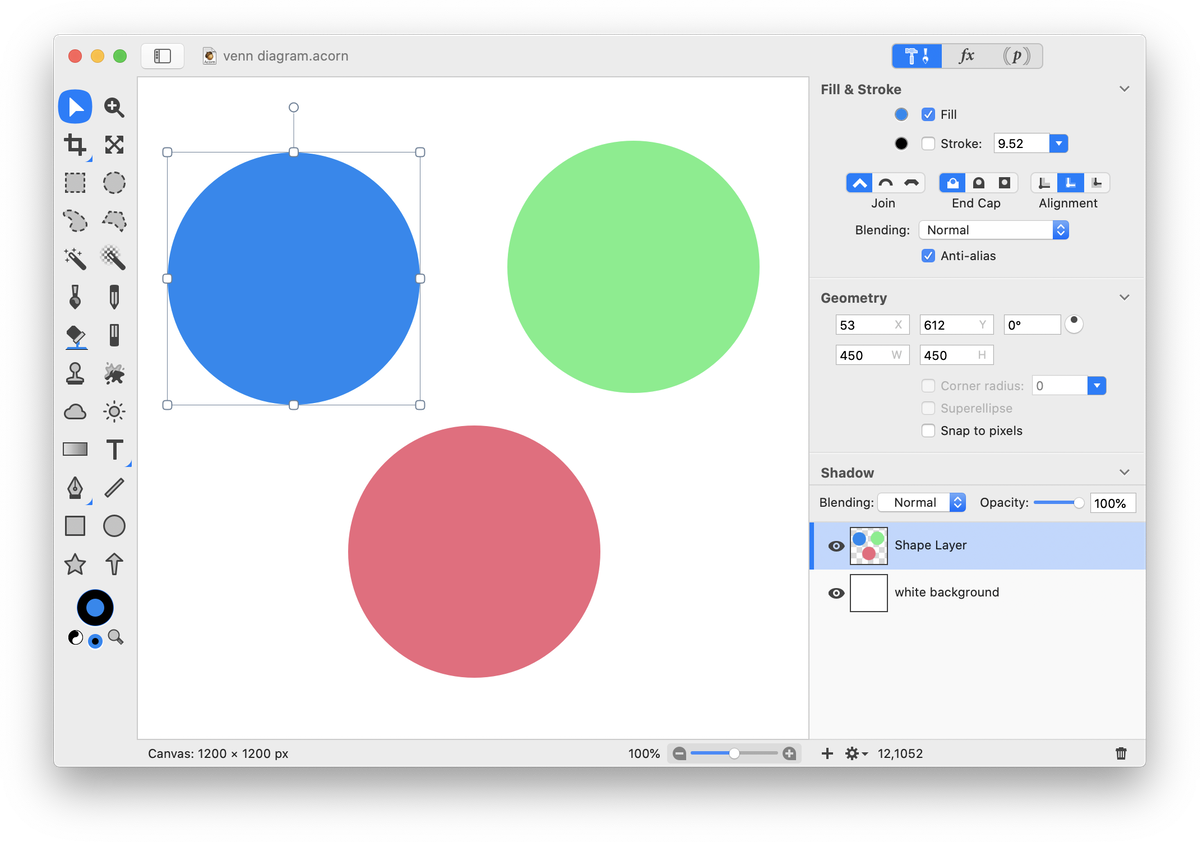
The first technique uses blending modes. To start, create a new image in Acorn, File ▸ New. The dimensions of 1200 x 1200 pixels with a white background is used here. Select the circle shape tool in the tools palette and make a circle with a fill but no stroke. Hold down the shift key when drawing the circle to create a perfect circle. Use the move tool to place it where you want it in the canvas.
Using the move tool, hold down the option key while dragging on the circle to duplicate the shape. Option drag on the circle again to create a total of 3 identical circles.
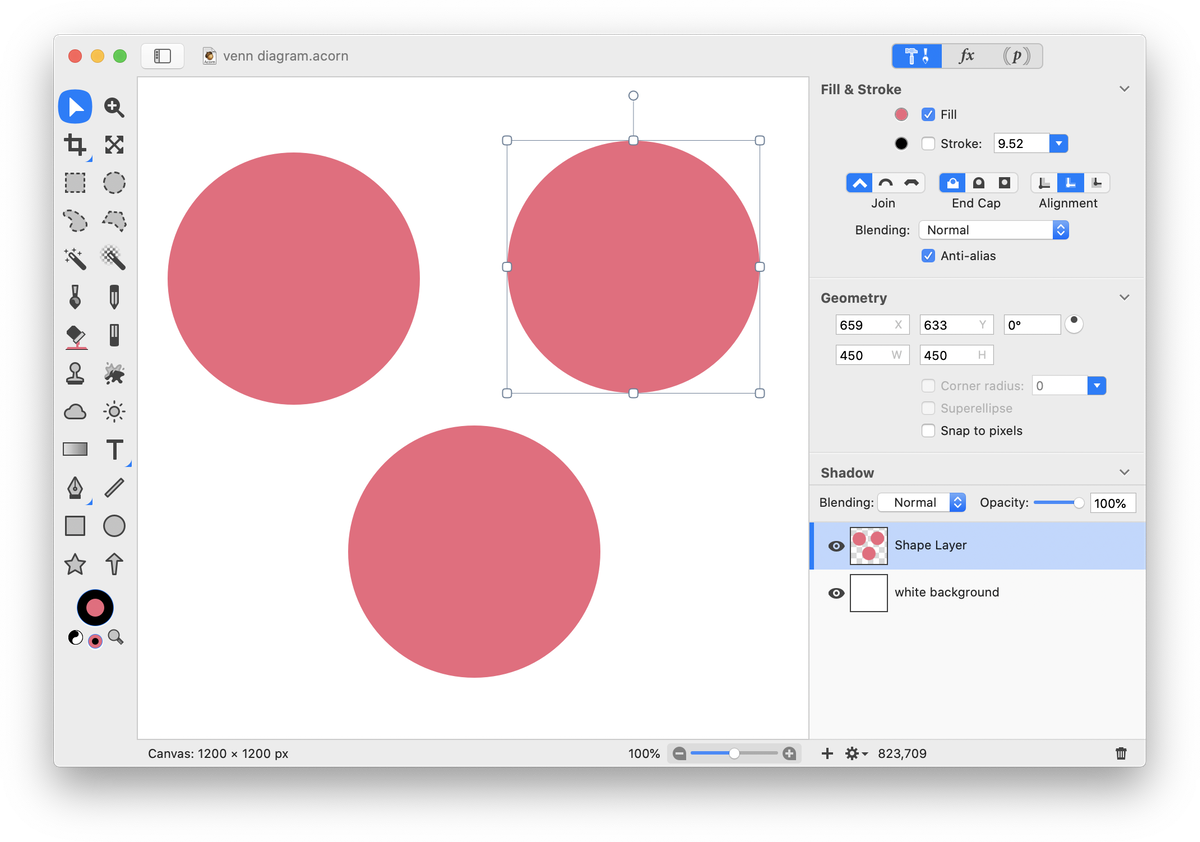
Use the move tool to select a circle. Click on the fill color well to change the fill color. Repeat so each circle is a different color.
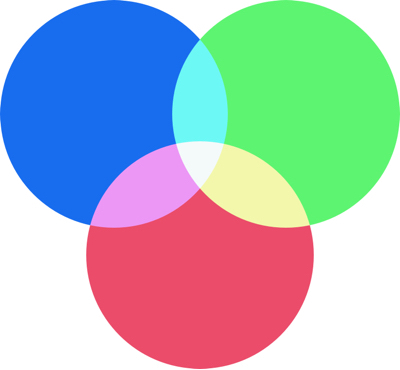
Move the circles into position so they are overlapping. With a circle selected, click on the blending mode drop down menu in the shape inspector palette. Change the blending mode. The blending mode shown here for the upper left and right placed shapes is ‘Screen’.
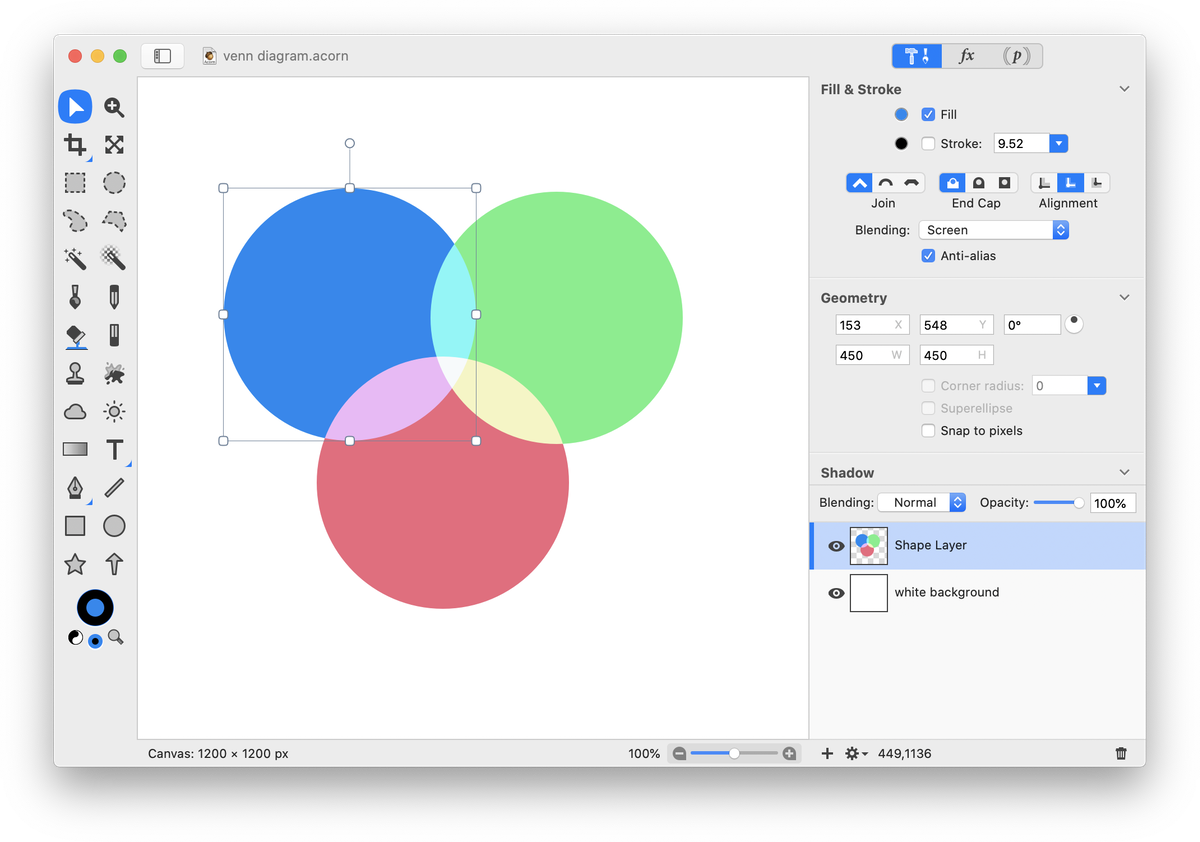
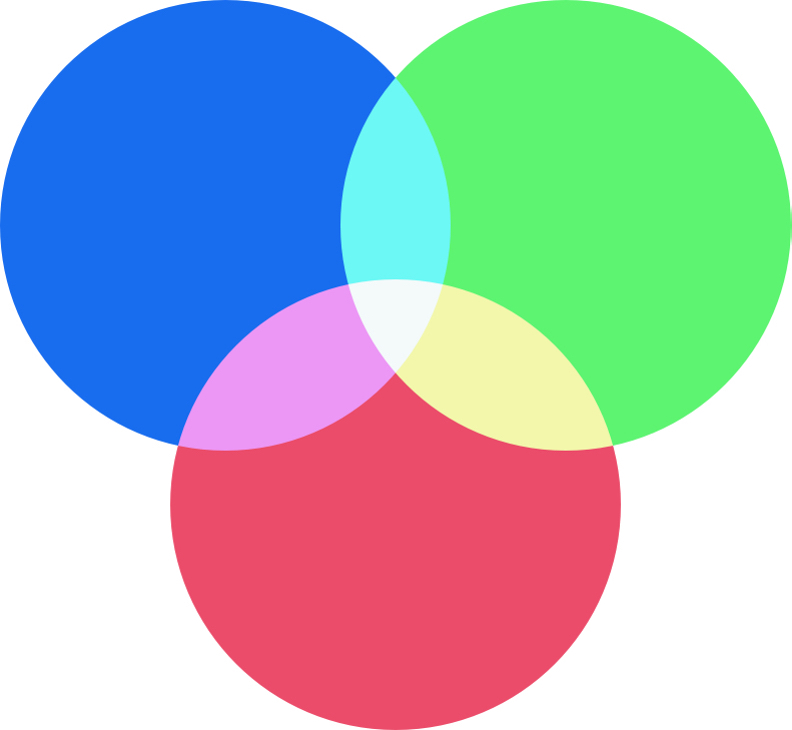
And that’s it. The diagram is ready for text or any other markup.
_______________________________________________________
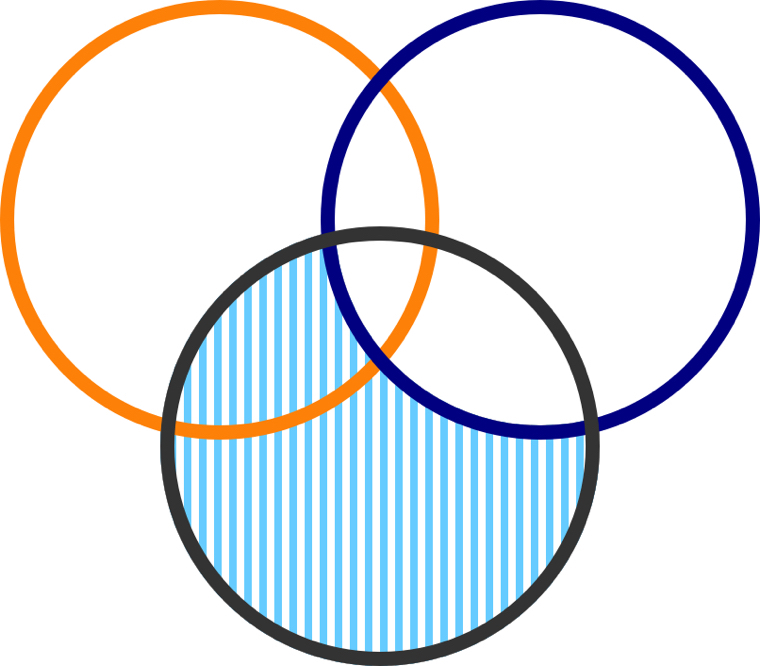
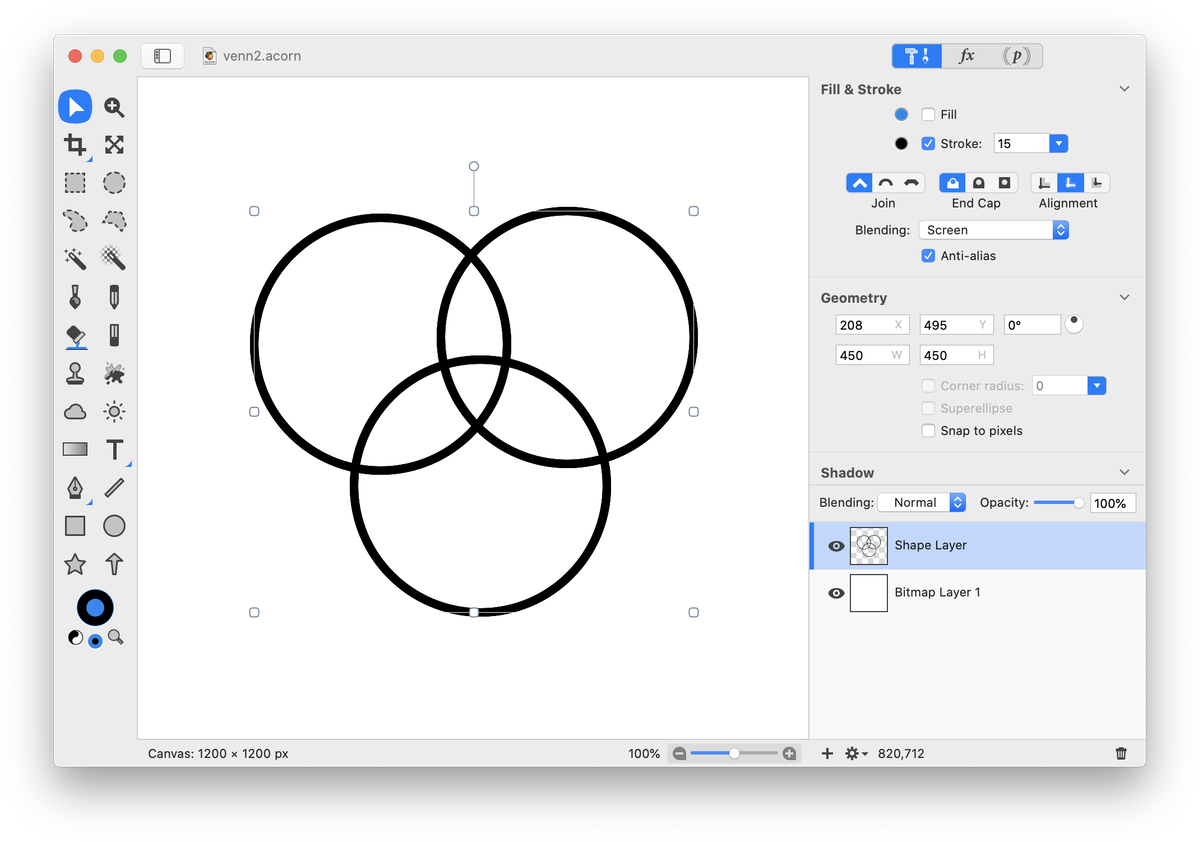
The second technique uses boolean operations to create a different style of Venn diagram. To start, create a new image in Acorn, File ▸ New. The dimensions of 1200 x 1200 pixels with a white background is used here. Select the circle shape tool in the tools palette and make a circle with a stroke but no fill. Hold down the shift key when drawing the circle to create a perfect circle. Use the move tool to place it where you want it in the canvas.
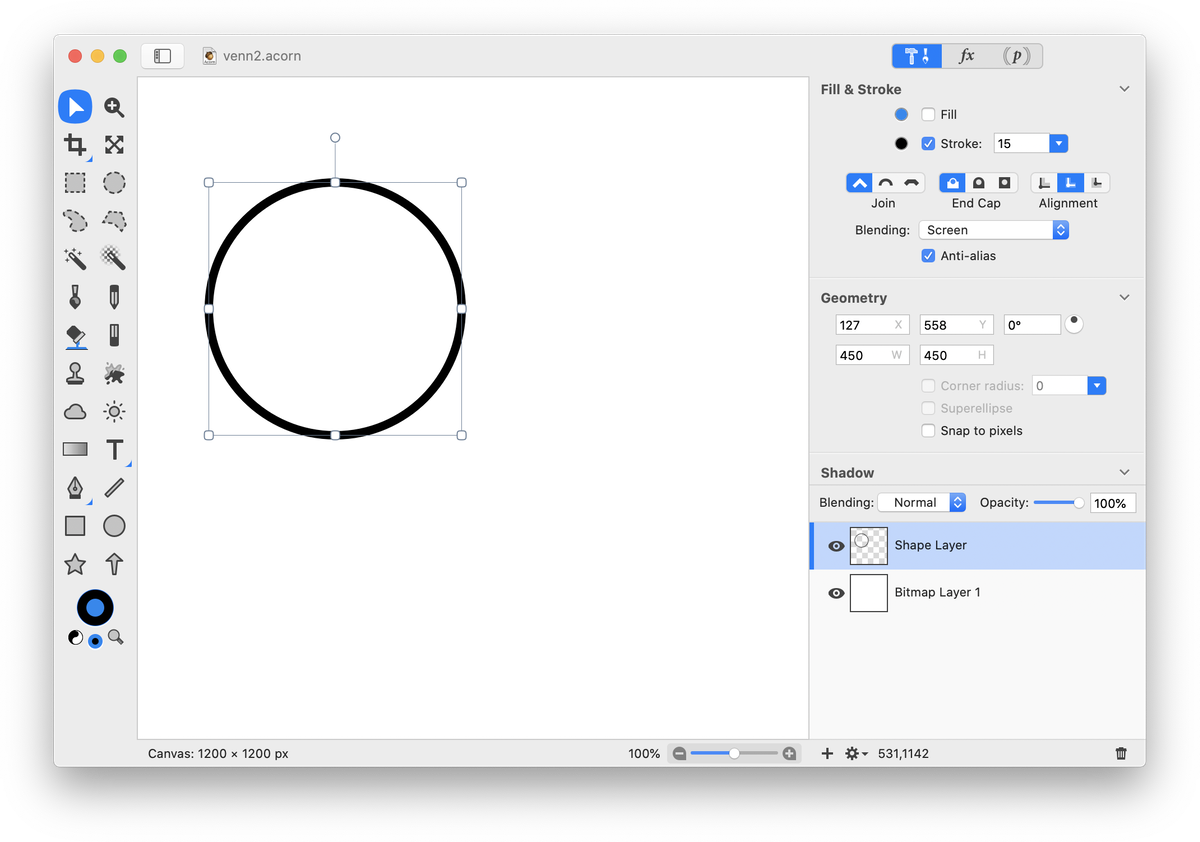
Using the move tool, hold down the option key while dragging on the circle to duplicate the shape. Option drag on the circle again to create a total of 3 identical circles. Move the circles into position so they are overlapping.
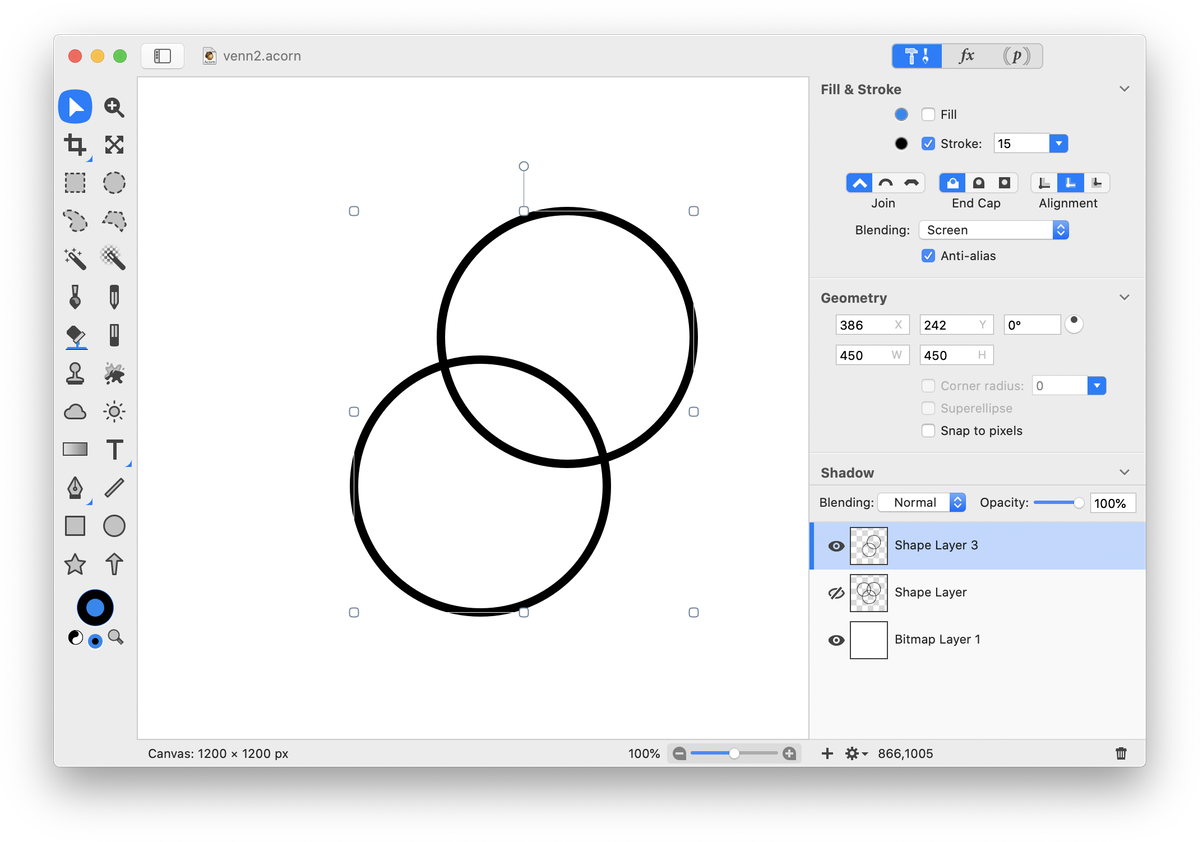
Using the move tool, hold down the shift key and click on two of the circles to select them. Go to Layer ▸ New Layer with Selection. Click on the visibility icon of the layer with the three circles present to hide the layer.
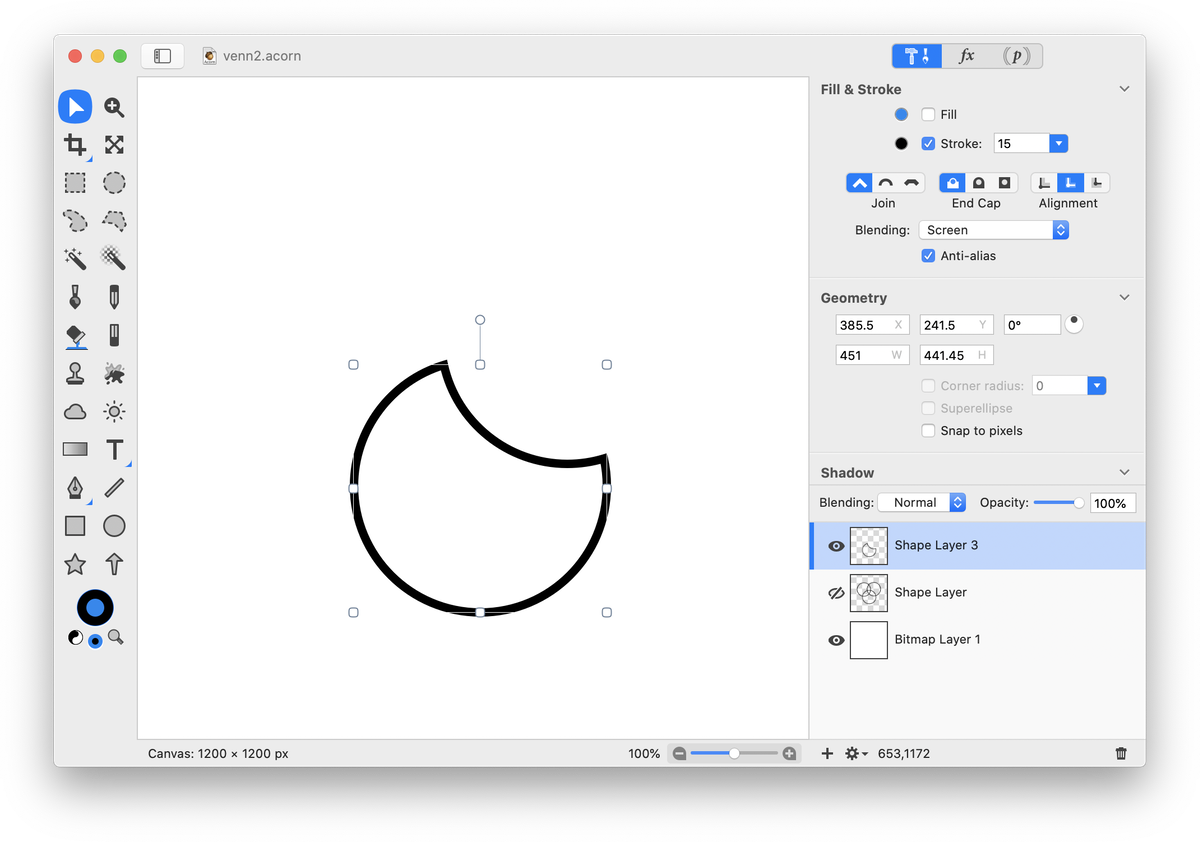
With the two circles still selected, go to Shape ▸ Difference Paths. This will subtract the upper shape from the bottom shape. To re-arrange which shape is subtracted, select one of the shapes and go to Shape ▸ Arrange ▸ Bring to Front (or) Send to Back and try the difference paths operation again.
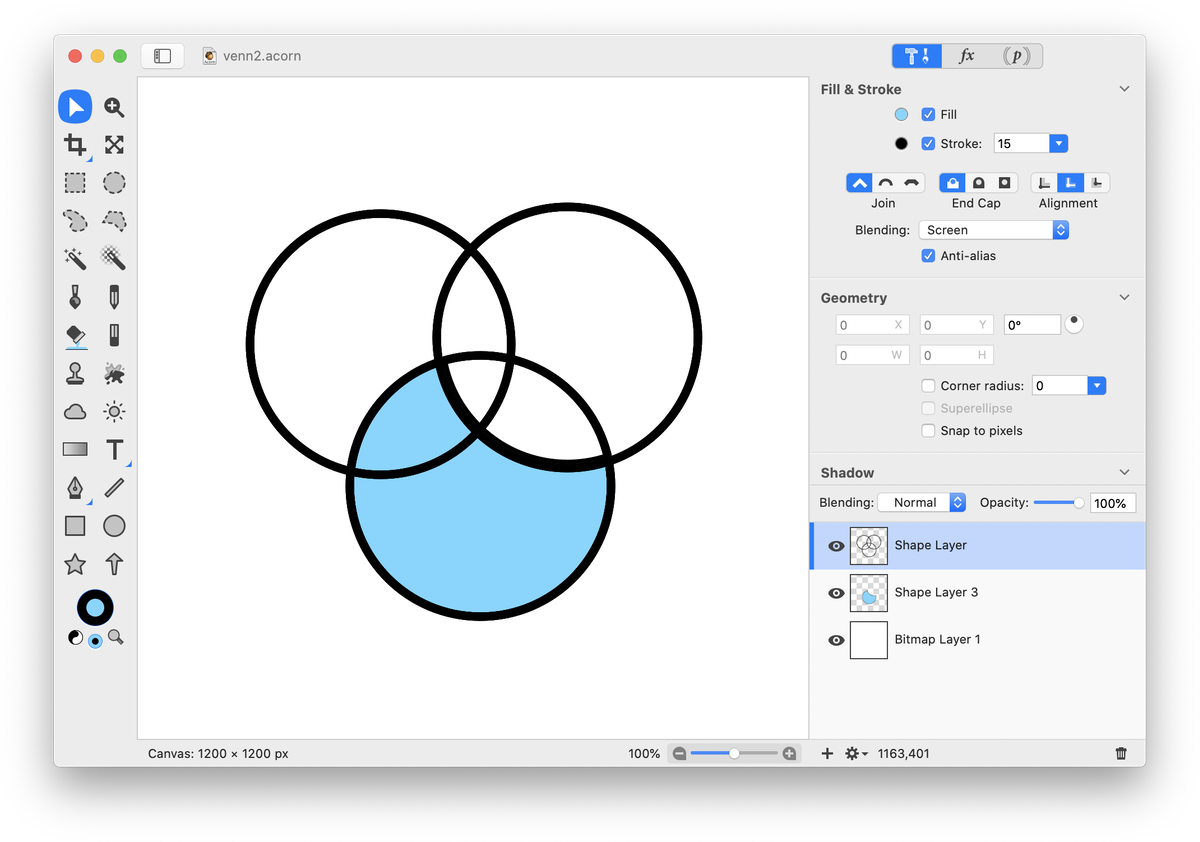
With the shape selected, go to the inspector palette and check the ‘fill’ box. Change the color of the fill if desired. Click the visibility icon of the layer with the three circles to unhide the layer. Move the three circles layer to the top of the layers list.
To change the fill of the Venn diagram to stripes, click on the layer with the single shape. Go to Filter ▸ Generator ▸ Stripes. Check the ‘Preserve Transparency’ box. Adjust the colors and width setting.
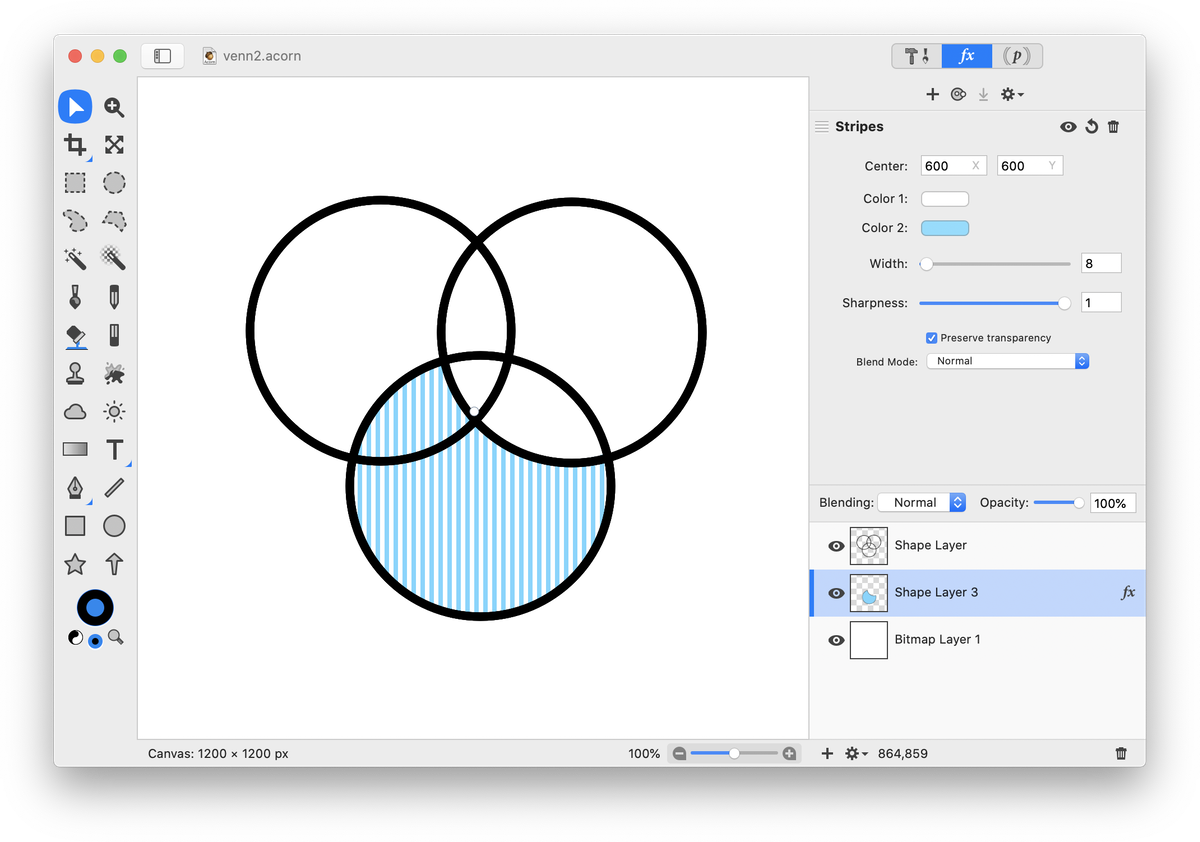
Adjust the stroke colors of the circles if desired.