Levels
 To bring up levels, go to Filter ▸ Color Adjustment ▸ Levels (⌘L), or Image ▸ Levels.
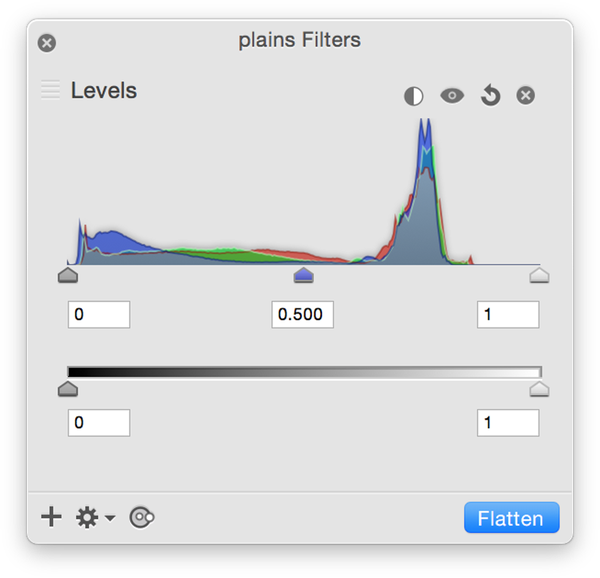
To correct or modify levels, simply drag the triangular slider controls located on the left, right, and center at the bottom of the histogram. The left slider controls the black point, the right slider controls the white point, and the middle slider controls the midtones.
![]() Auto-Levels: Click on the auto-levels button and the sliders will automatically move to where Acorn thinks they should be located.
Auto-Levels: Click on the auto-levels button and the sliders will automatically move to where Acorn thinks they should be located.
![]() Levels Visibility: Click this button to toggle between the original image levels and the modifications you have made.
Levels Visibility: Click this button to toggle between the original image levels and the modifications you have made.
![]() Reset Levels: The reset button removes any changes you have made to the curve.
Reset Levels: The reset button removes any changes you have made to the curve.
![]() Remove Levels: To completely remove the levels filter, hit the ‘x’ button.
Remove Levels: To completely remove the levels filter, hit the ‘x’ button.
Histogram
Levels are a different way of looking at an image. Instead of the picture being displayed in its normal viewable state, it is shown as a bar graph called a histogram. The histogram is essentially a count of how many times each color shows up in the image.
To improve the image below, leave the slider on the left alone since it is already under the color peaks. Pull the right slider in towards the left until it rest under the start of where the closest peak tapers off. Then play around with dragging the midtones slider to the left to darken the midtones a bit. Every image is different, so experiment to get the hang of things.
Be sure to read up on the Filters tutorial to learn more about how filters work. You can stack the levels filter with endless combinations of other filters to create interesting and unique effects to your images non-destructively!
Example
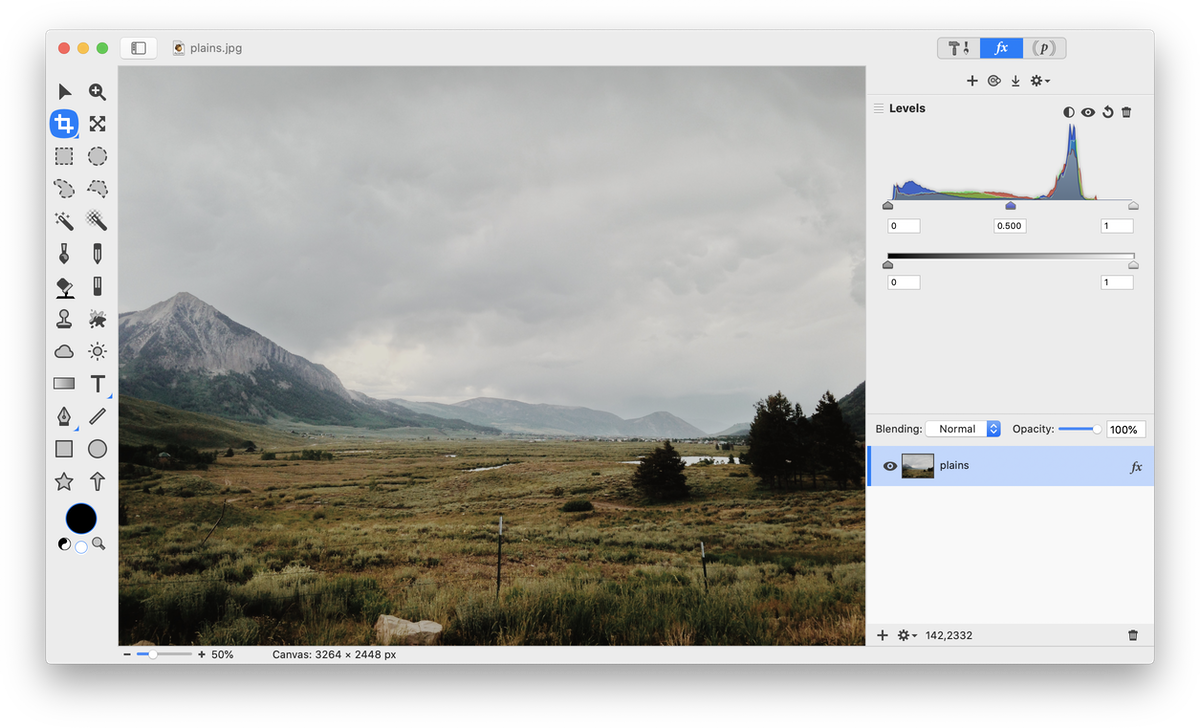
Before Levels Adjusted
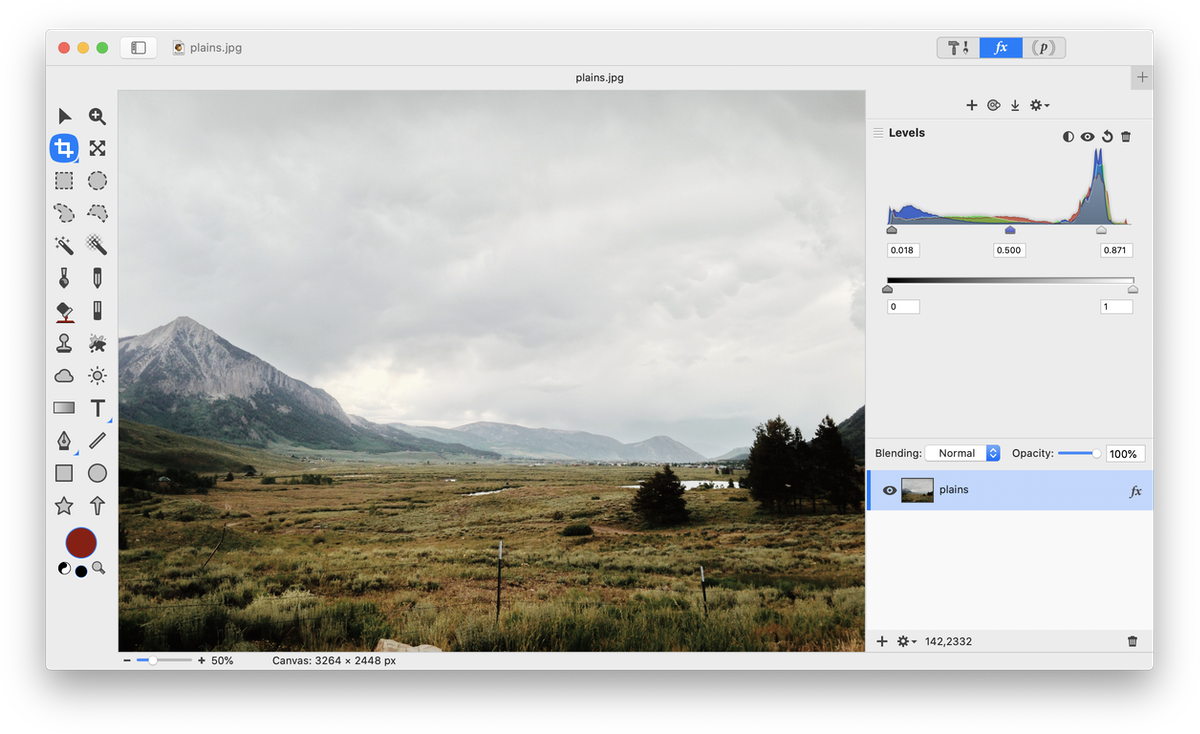
After Levels Adjusted
Output Levels
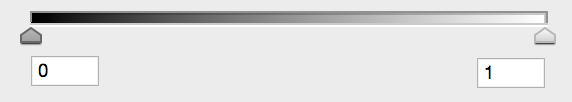
Below the histogram is a slider with two control tabs. These control how black the blacks are, as well as the whites. If you bring both tabs in towards the middle you will decrease the contrast of your image. Try experimenting with them to get the hang of it. You will see how your histogram changes when you change the output slider positions.