Using a Debugger with Retrobatch
Retrobatch uses Safari's JavaScript debugger to help you figure out problems when developing plugins. To enable this feature in Safari, first open up the Safari's Preferences via the Safari ▸ Preferences… menu item, click on the Advanced tab, and make sure the option "Show Develop menu in menu bar" is checked.
Next, choose the Develop ▸ (your computer name) ▸ Automatically Show Web Inspector for JSContexts menu item. This tells Safari to listen to any applications that create a JSContext debugger anytime Retrobatch runs a script.
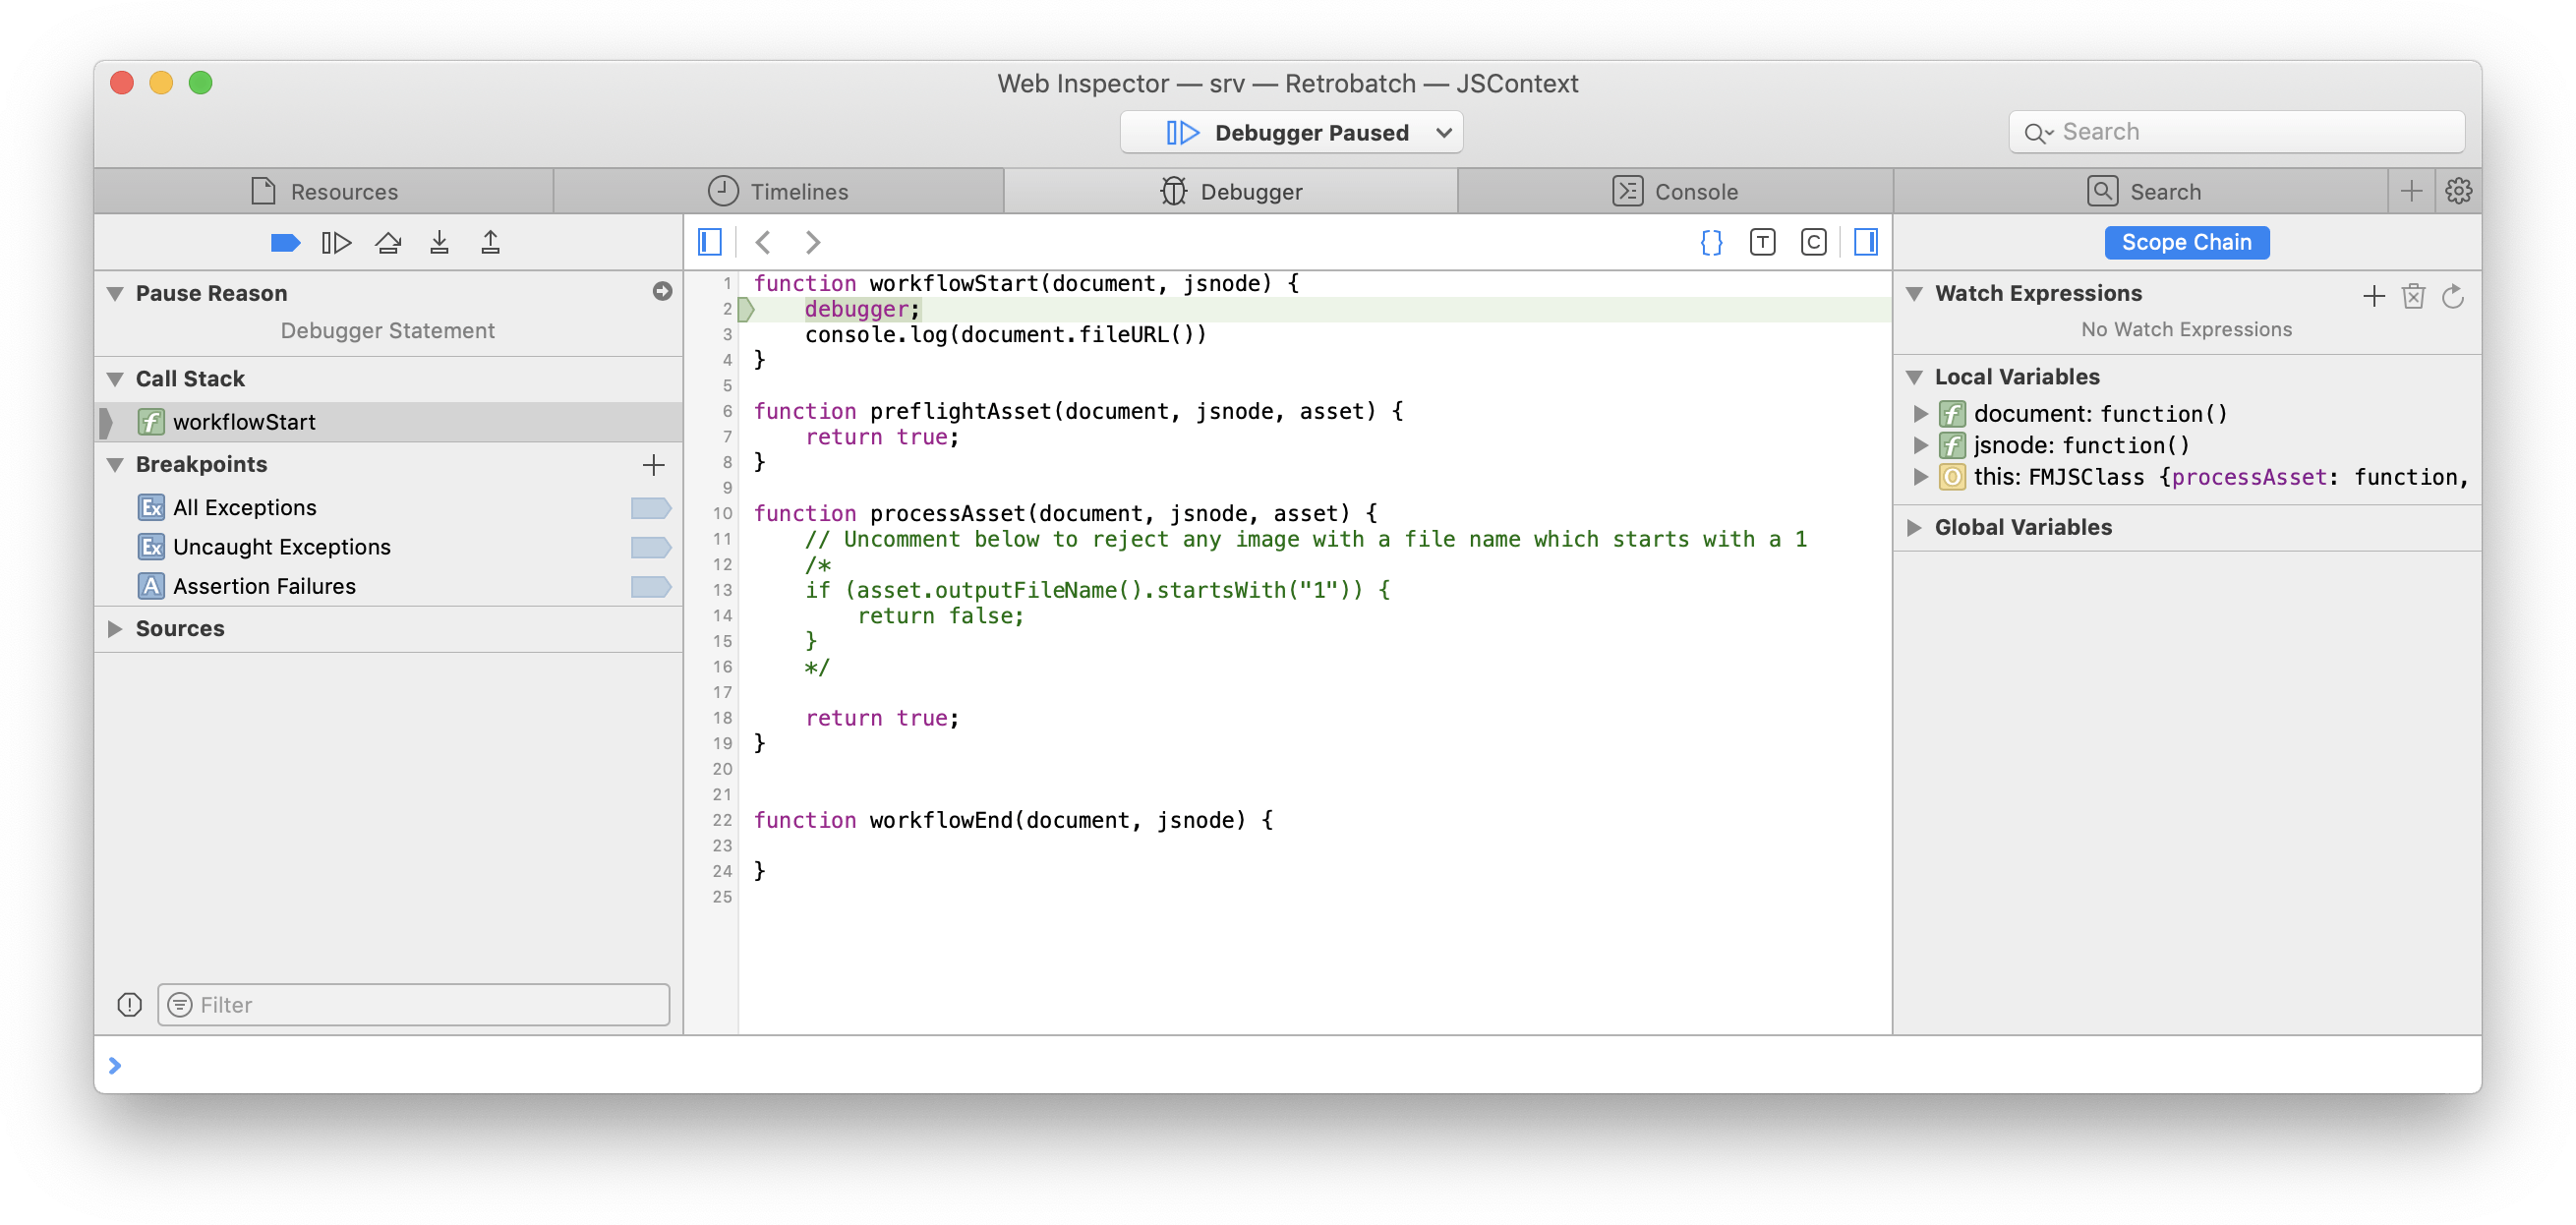
And to set a breakpoint in your JavaScript code, just write debugger;, and JavaScript execution will pause and Safari will show your source: